


The 7 best mobile app analytics tools

Contents
Mobile app analytics tools help you understand how users interact with your app, but the right tool depends on what you're trying to do. Debugging user issues? You'll want session replays. Optimizing conversion funnels? You need retention charts and path analysis. Measuring ad spend? Attribution and ROI tracking are essential.
Some tools try to do it all. Others specialize. Choosing the wrong one means either paying for features you don't need, or stitching together integrations that create a messy workflow.
In this guide, we compare the 7 best mobile app analytics tools – from all-in-one platforms to specialized solutions – so you can find the right fit for your team.
What features do you need in a mobile app analytics tool?
A good mobile app analytics tool gives you visibility into how users actually experience your app – what they tap, where they drop off, and what keeps them coming back.
Most solid tools include:
- Event tracking for key user actions (sign-ups, purchases, feature usage)
- Funnels and conversion analysis to identify drop-off points
- Retention charts to measure how well you keep users over time
- User segmentation and cohorts for targeted analysis
- Mobile SDKs for iOS, Android, React Native, and Flutter
More advanced tools go further with:
- Session replay so you can watch exactly how users navigate your app and where they get stuck
- Heatmaps and touch tracking to see which UI elements get the most attention
- A/B testing and feature flags to experiment safely and roll out changes incrementally
- Crash and error monitoring to connect technical issues to user impact
- Marketing attribution to measure which campaigns and channels drive installs and revenue
Here's how some of the most popular mobile app analytics tools compare:
1. PostHog
Best for: Engineering and product teams
What is PostHog?
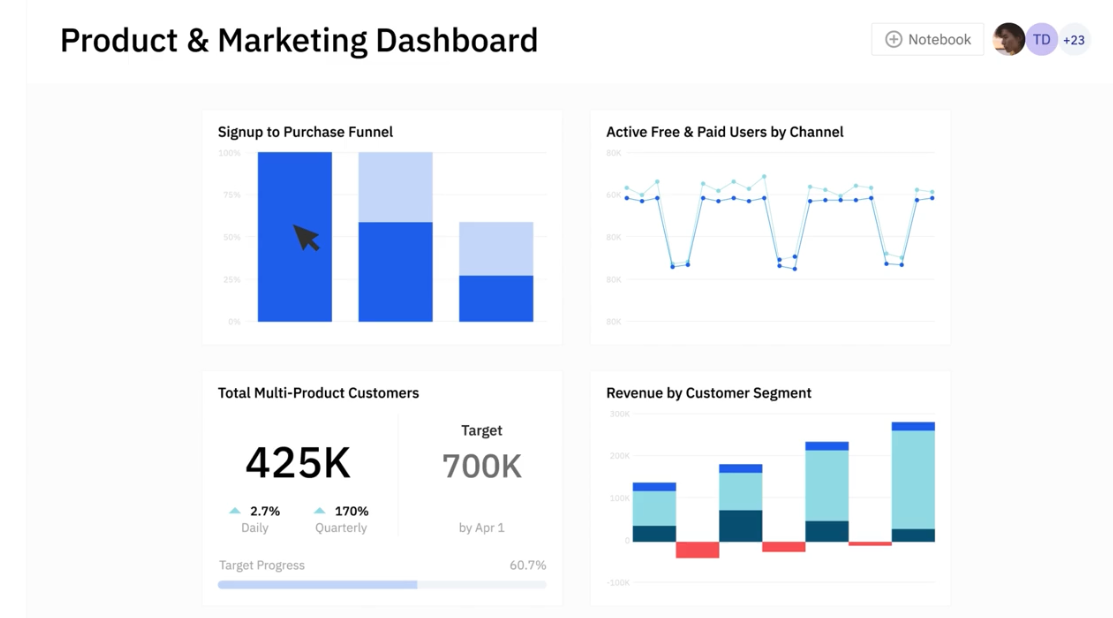
PostHog (that's us 👋) is an all-in-one platform built to help engineers create better products. It includes product analytics and a whole bunch more, such as A/B testing, feature flags, error tracking, LLM analytics, web analytics, surveys, and session replays.
It's designed for product-minded engineers, growth teams, and product managers who need to move fast and iterate based on reliable, actionable insights.
Key features
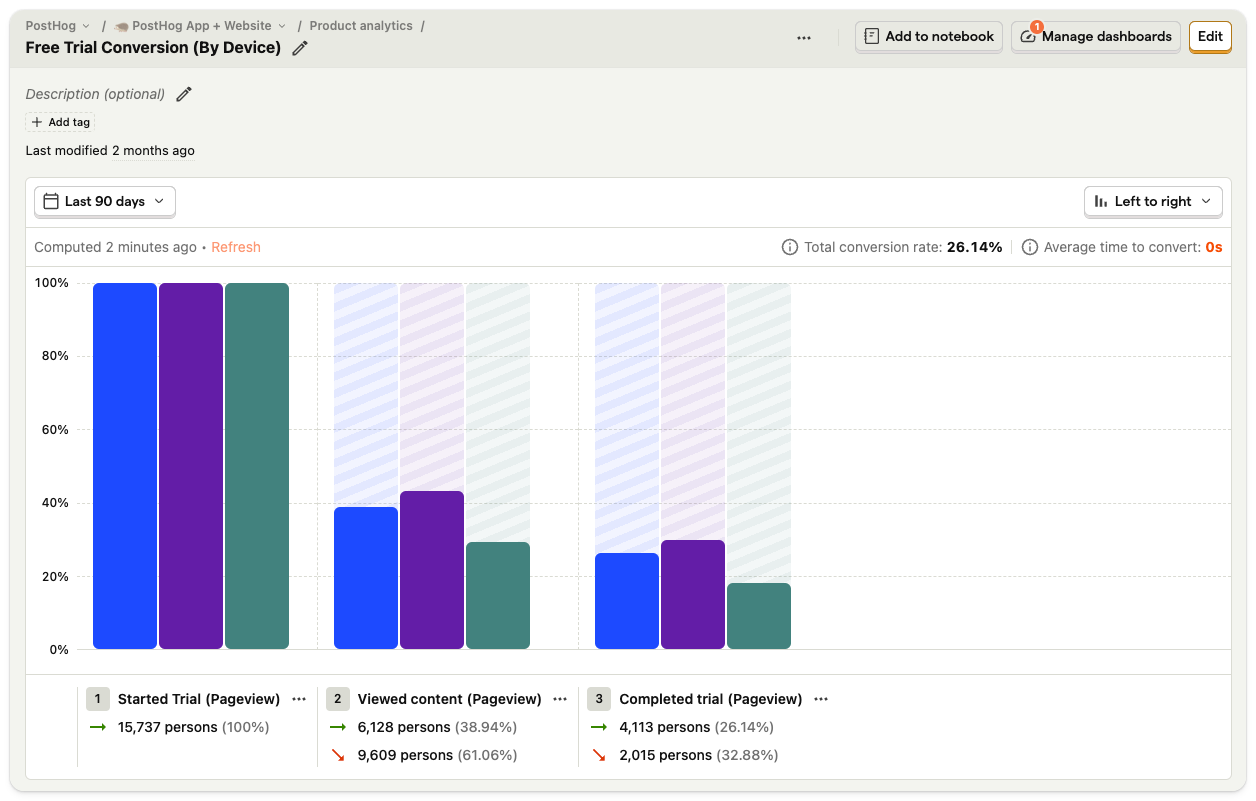
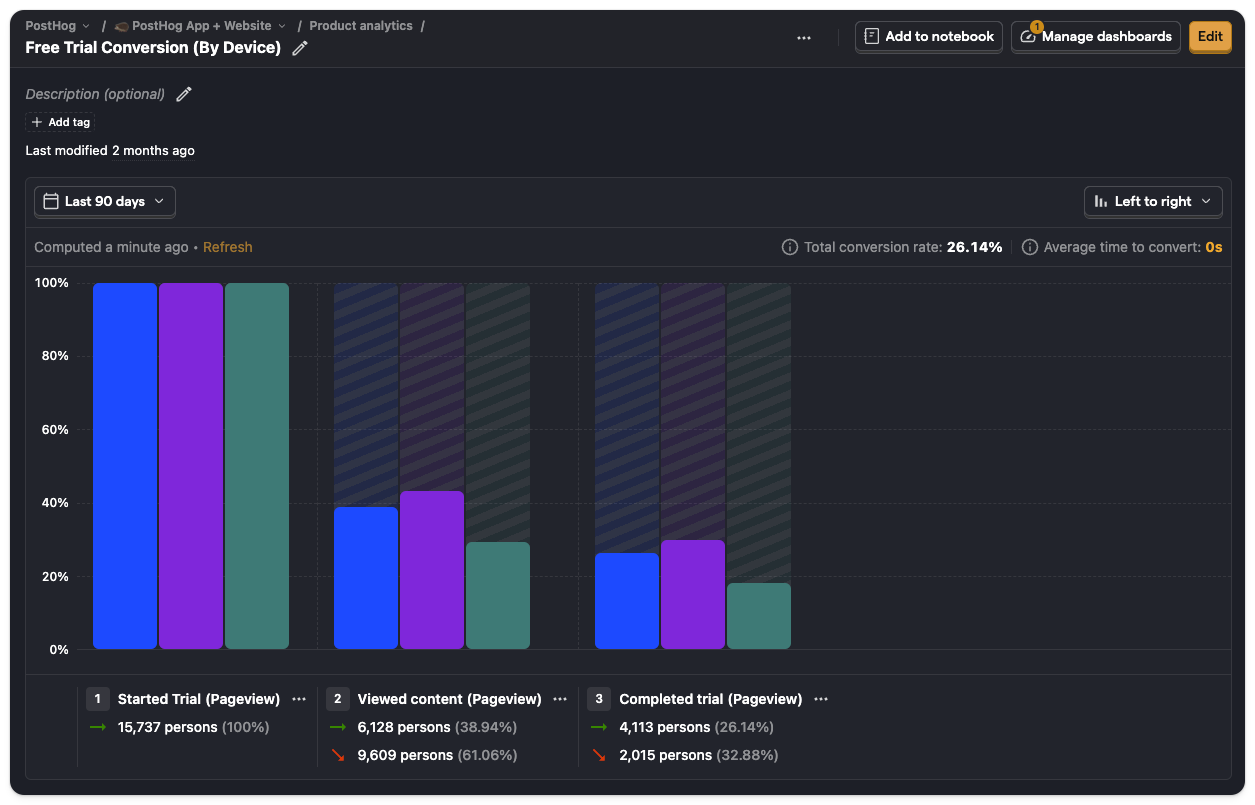
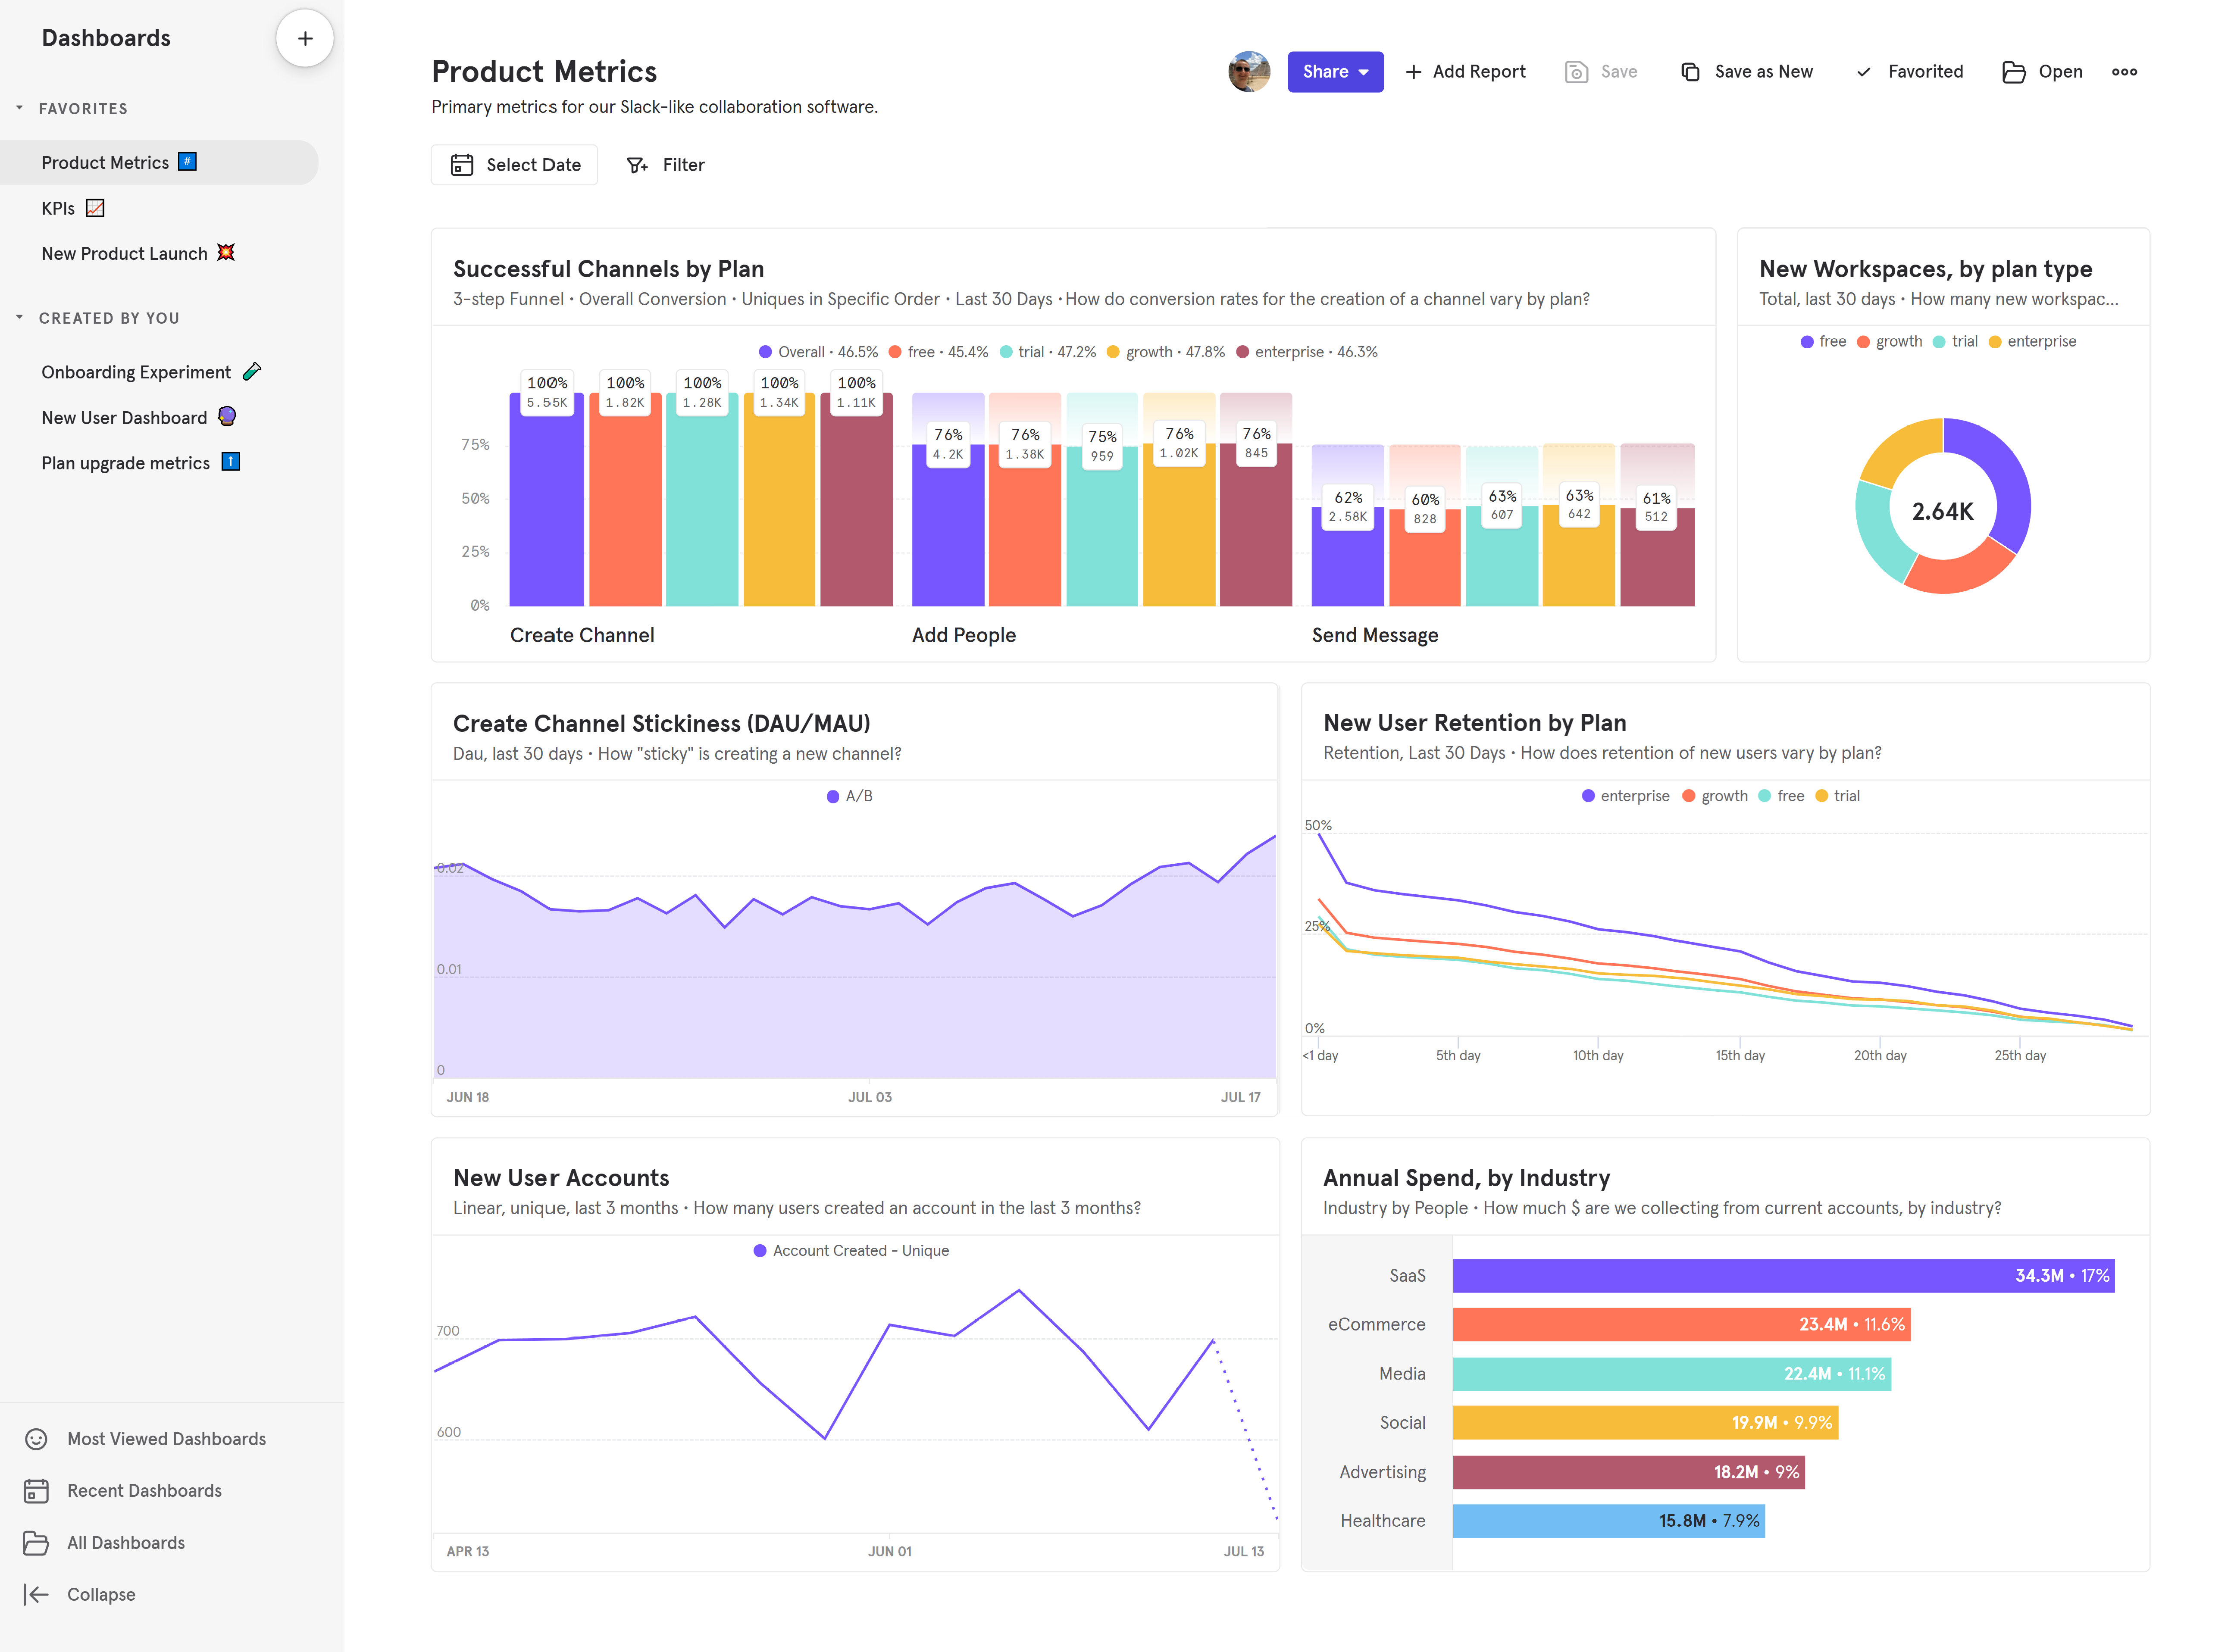
Product analytics: Custom trends, funnels, user paths, retention analysis, and segment user cohorts. Also, direct SQL querying for power users.
Session replays: View exactly how users are using your app. Includes event timelines, console logs, network activity, and 90-day data retention.
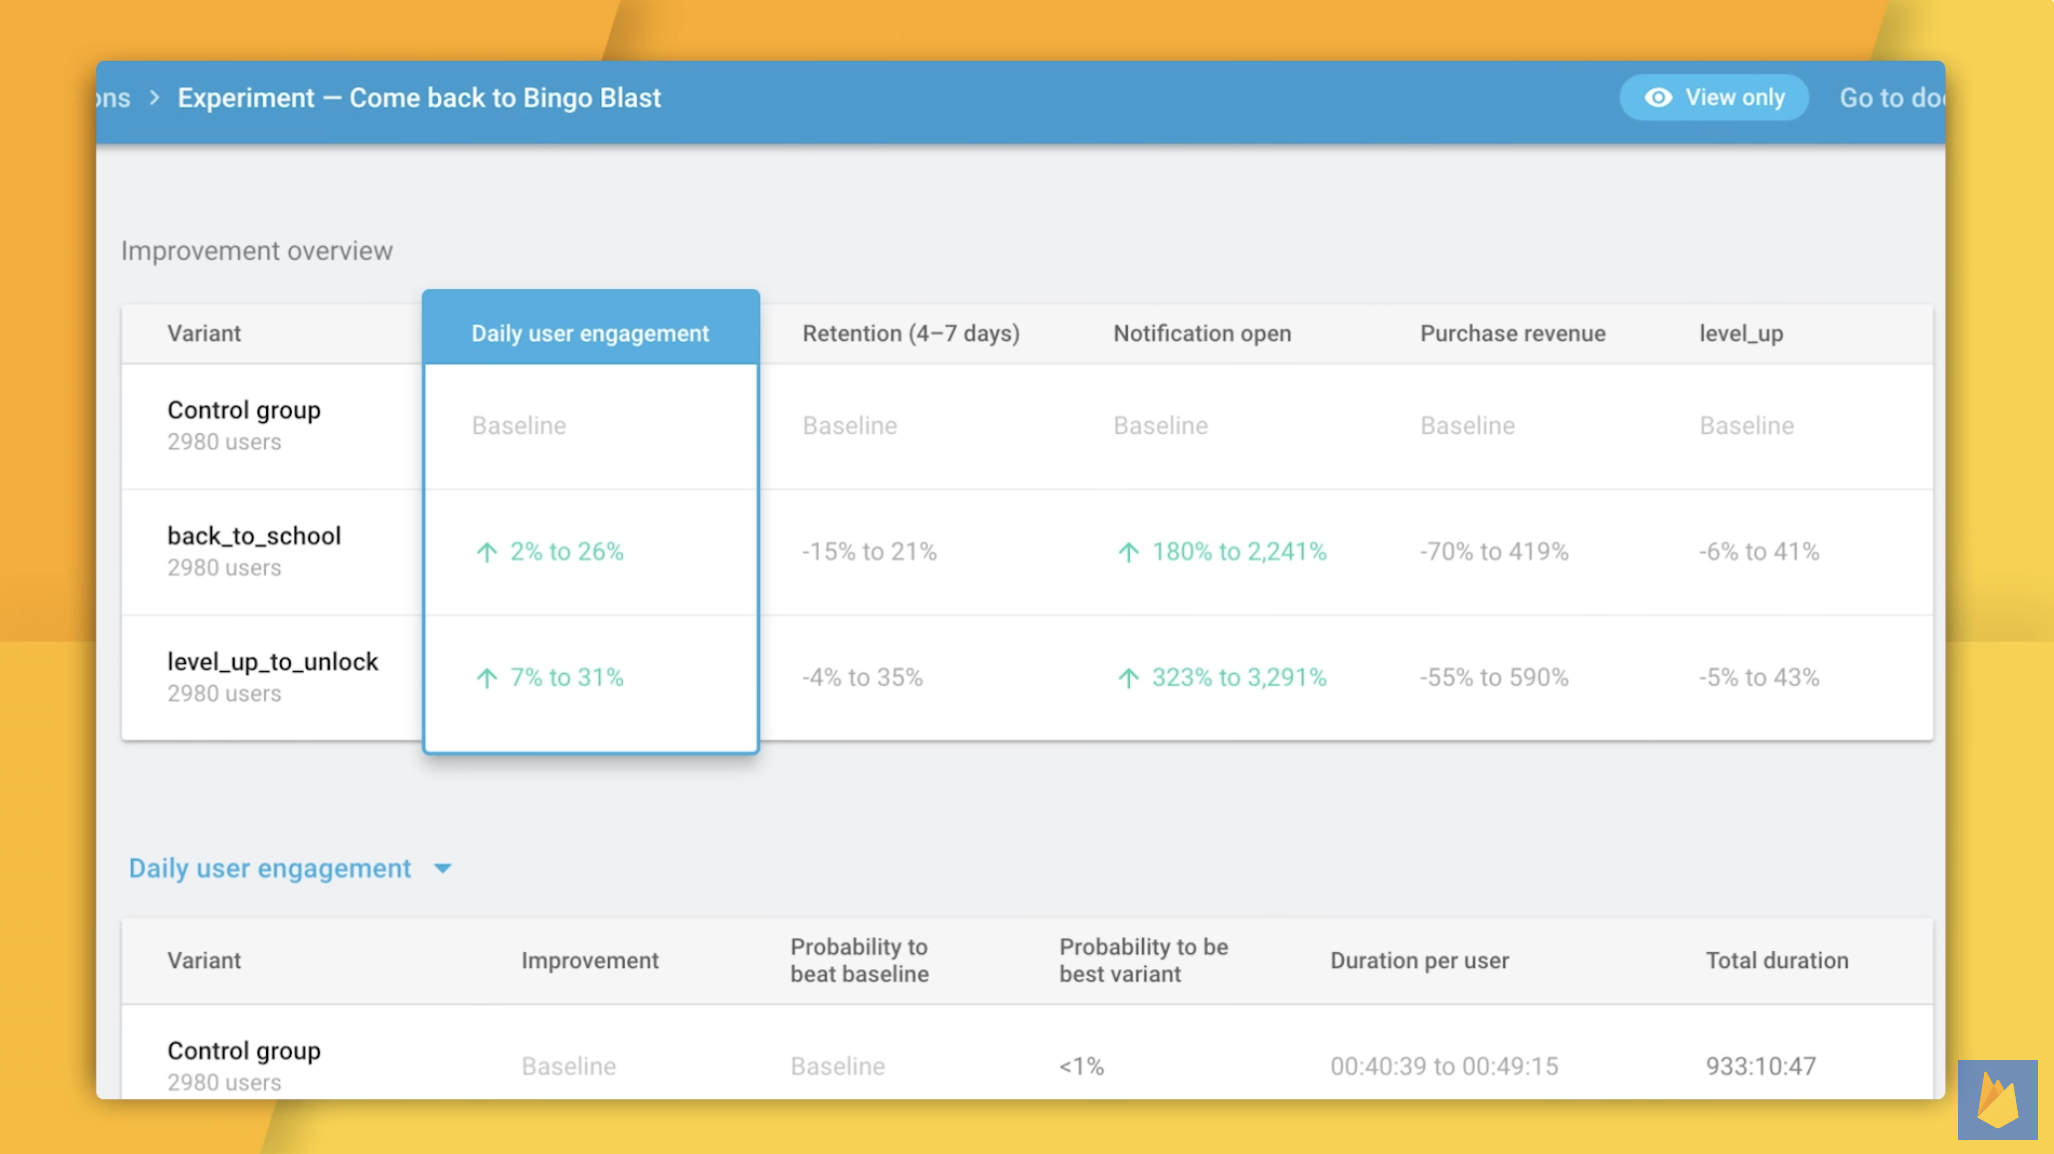
A/B tests: Experiment in your app with up to nine test variations and track impact on primary and secondary metrics. Auto-calculate test duration, sample size, and statistical significance.
Feature flags: Rollout features safely with local evaluation (for faster performance), JSON payloads, and instant rollbacks.
Data warehouse: Combine data from all your different sources for easy analysis and comprehensive insights.
How much does PostHog cost?
PostHog has transparent pricing based on usage. It's free to get started and completely free for the first 1 million analytics events. After this free monthly allowance, pricing starts at $0.00005/event (or $5 for 100k events), and events cost progressively less the more you use. You can also set billing limits to ensure you don't get surprise bills.
Startups less than 2 years old and with under $5 million in funding can apply for PostHog for Startups, which includes $50,000 in additional free credits.
Why do companies use PostHog?
According to G2 reviews, companies use PostHog because:
It's many tools in one: PostHog can replace tools like Mixpanel (analytics), UXCam (session replay), and Statsig (A/B testing and feature flags). This simplifies workflows and ensures all product data is in one place.
They need a complete picture of users: PostHog includes every tool necessary to understand users and build better products. This means creating funnels to track conversion, watching replays to see where users get stuck, and testing solutions with A/B tests.
Pricing is transparent and scalable: Reviewers appreciate how PostHog's pricing scales as they grow. There's a generous free tier. Companies eligible for PostHog for Startups also get $50k in additional free credits.
Bottom line
For teams looking for all the tools they need to improve their products, PostHog makes for a great choice. This is especially true for startups and scaleups thanks to it having a generous free tier.
2. Mixpanel
Best for: Product managers, desginers and marketing teams
What is Mixpanel?
Mixpanel is one of the most popular product analytics tools on the market. Founded in 2009, it's expanded beyond pure analytics to include session replay (web and mobile) and warehouse connectors.
Key features
Product analytics: Track user behavior, KPIs, and core metrics with trends, retention, and flows.
Collaborative boards: Build analysis in collaborative boards that can include reports, text, videos, and GIFs. Embed these boards in other tools.
Alerts: Get automated notifications when there are anomalies in metrics or if they fall outside a positive or negative range.
Filtered data views: Hide and filter data on a per-team basis to reduce noise and separate data for privacy reasons.
Session replay: Watch real user sessions on web, iOS, and Android. Includes server-side stitching to view replays for backend and warehouse events.
How much does Mixpanel cost?
Pricing starts at $28/month for up to 10k events and scales with events. 2 million events cost $258/month.
Why do companies use Mixpanel?
Looking at G2 reviews, companies choose Mixpanel to:
Eliminate the need for data analysts: Mixpanel helps reviewers structure large volumes of data, and make data-driven decisions, reducing their reliance on dedicated data analysts to produce insights.
Track and target campaigns: Marketers appreciate the ability to create user segments and target specific users, enabling more personalized campaigns and improved user engagement.
Understand user behavior: In common with most analytics tools, Mixpanel's users mostly want to understand user behavior, identify bottlenecks, and monitor core metrics like conversion rates, activation, and retention.
Bottom line
Mixpanel is great for teams who want powerful yet easy to use analytics and don't need any of the extra features that other alternatives on this list provide such as feature flags or A/B testing.
3. UXCam
Best for: Product managers in enterprise companies
What is UXCam?
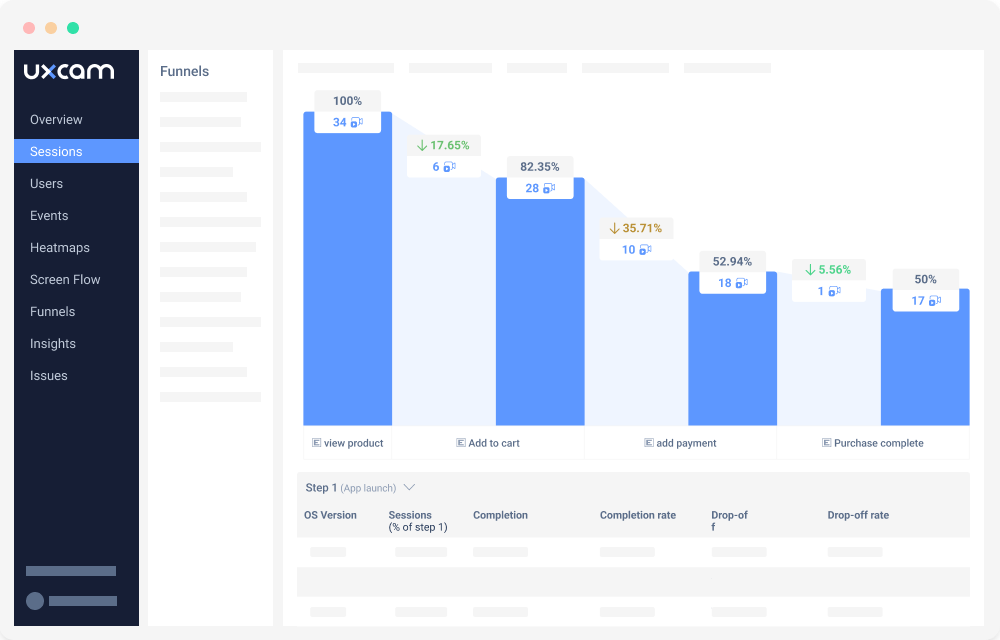
UXCam is a platform built solely for mobile apps. It includes a full-suite of analytics features as well as session replays and heatmaps.
It's designed to provide deep insights into user behavior, helping product managers understand how users interact with their apps.
Key features
Product analytics: Custom trends, funnels, user paths, retention analysis, and segment user cohorts.
Session replays: View exactly how users are using your app. Includes event timelines, console logs, network activity, and 90-day data retention.
Heatmaps: See where users tap, where they scroll to, and the areas that get the most attention.
How much does UXCam cost?
UXCam has a free plan with 3,000 monthly sessions and 30-day replay retention. Paid plans (Starter, Growth, Enterprise) are session-based with custom pricing – the company's sales team will give you a quote after you've spoken to them. They also offer a 14-day free trial with access to all Growth features, 100,000 sessions, and 1 million custom events.
Why do companies use UXCam?
Looking at G2 reviews, companies choose UXCam because:
They need insights on user behavior: Insights show what users are doing, where their attention is going, and how they are spending their time. Users love the realizations they get with UXCam's tools.
It's easy to use: Reviewers note how easy UXCam is to set up and use. This means they can go from idea to actionable learnings quickly.
Heatmaps and scrollmaps: Seeing clicks and scroll depth works well and creates actionable insights for design and product teams. Helps improve UX and page designs.
Bottom line
UXCam is ideal for product managers who need in-depth insights into user behavior. Despite opaque pricing, its ease of use and actionable insights make it a valuable tool.
4. Amplitude
Best for: Product managers, data analysts, marketing teams
What is Amplitude?
Amplitude was one of the original product analytics tools. Many large enterprise customers, like Ford, NBCUniversal, and Walmart rely on it. In recent years, it’s also added A/B testing and feature flags.
Key features
Product analytics: Funnel and retention analysis, user paths, behavioral cohorts, custom dashboards, and more.
A/B testing: Test new features on specific targets and analyze with primary, secondary, and counter metrics.
Customer data platform: Combine analytics data with third-party tools for data governance, identity resolution, and data federation.
AI insight builder: Generate insights based on natural language requests, like "What is my purchase conversion rate?"
How much does Amplitude cost?
Amplitude has a free Starter plan with 10,000 monthly tracked users (MTUs), 1,000 session replays, and core analytics features. The Plus plan starts at $49/month on an annual plan. Growth and Enterprise plans have custom pricing based on MTUs and event volume.
Why do companies use Amplitude?
According to G2 reviews, people like Amplitude because:
It's simple to use: Amplitude makes it easy for non-technical users to get insights about their product and make improvements. Amplitude is built for users like product managers and marketers, making it a popular choice for them.
It offers built-in A/B testing: Amplitude offers integrated experimentation features. This enables companies to run experiments on existing cohorts, and then analyze the data in a single place.
It helps them become data-driven: Amplitude users appreciate it helps them become data-driven. It becomes easy to add data, visualize it, and make decisions, and they can use it as a source of truth thanks to its built-in customer data platform.
Bottom line
Amplitude is a good choice for product and marketing teams who want powerful analytics with session replay and experimentation. Note that heatmaps are web-only and require a Growth or Enterprise plan.
5. Firebase (Google Analytics)
Best for: Apps already using Firebase's other features
What is Firebase?
Firebase is Google's mobile app development platform. It includes analytics, realtime databases, push notifications, in-app messaging, and more. Its analytics feature is powered by Google Analytics.
Key features
Comprehensive analytics: Gain in-depth insights into user behavior and app performance.
Real-time data: Access real-time data on user interactions, app crashes, and performance metrics.
Push notifications: Engage users with targeted push notifications based on their behavior and preferences.
In-app messaging: Send personalized messages to users within your app to guide them through key actions.
How much does Firebase cost?
Firebase follows a two-tier model: the Spark plan (free) includes generous quotas for most services, while the Blaze plan (pay-as-you-go) charges only for usage beyond free limits. Crashlytics, Remote Config, A/B Testing, and Cloud Messaging are all free with unlimited usage.
Why do companies choose Firebase
According to G2 reviews, companies choose Firebase because:
It's a comprehensive toolkit: Firebase offers a broad range of tools beyond analytics, such as push notifications, in-app messaging, and Crashlytics, making it an all-in-one tool for app development and management.
It's easy to use: Reviewers appreciate how easy Firebase is to use, making app management simple.
It integrates with other Google services: Firebase integrates smoothly with other Google services, providing a powerful development and analytics ecosystem.
Bottom line
Firebase analytics is a great choice for companies already leveraging it's other features or any of Google's other products.
6. Appsflyer
Best for: Marketing teams
What is Appsflyer?
Appsflyer is a platform that focuses on marketing attribution rather than product analytics. It helps marketing teams understand which campaigns, channels, and ad creatives drive app installs and conversions, with built-in support for iOS privacy frameworks.
Key features
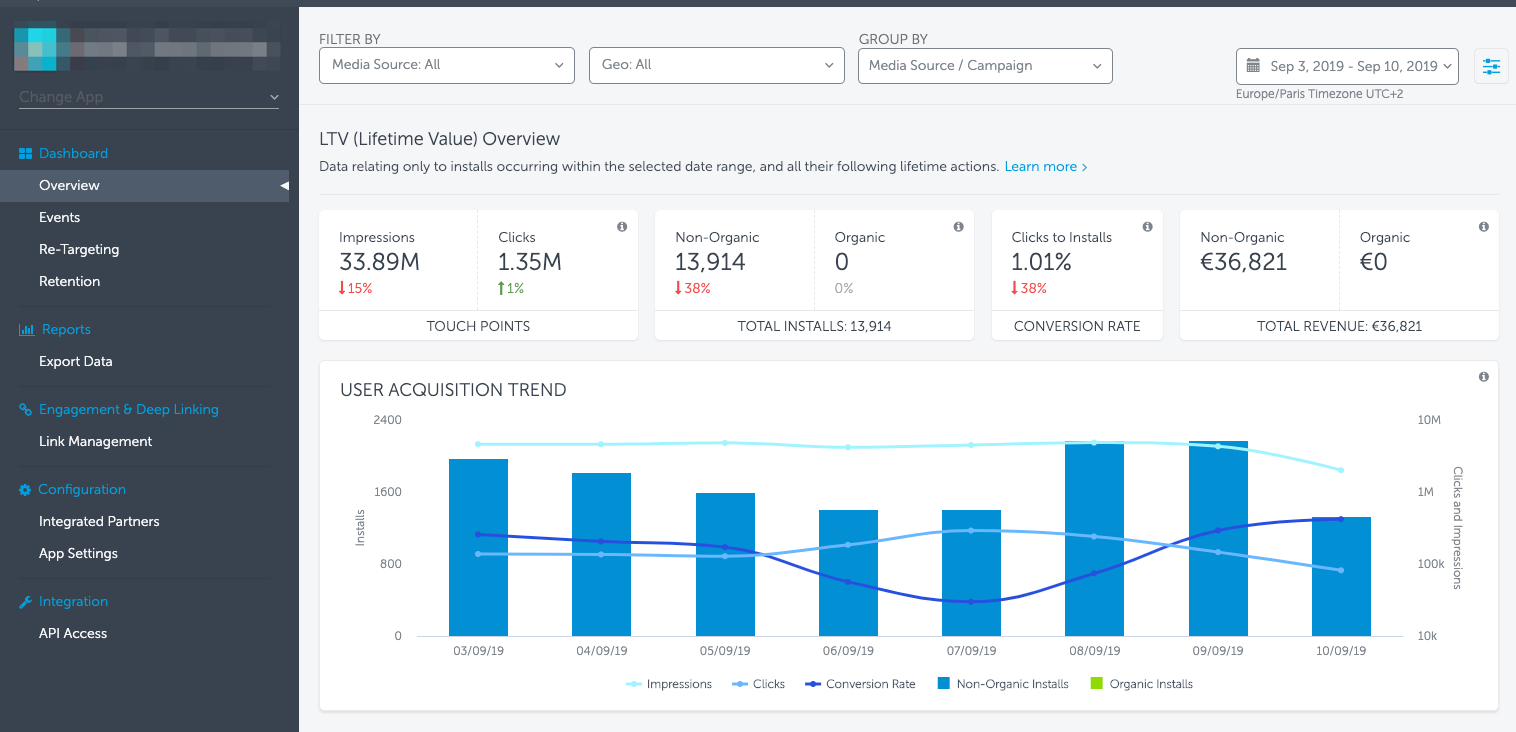
Attribution: Appsflyer provides detailed attribution data, allowing marketers to see which campaigns, channels, and touchpoints are driving installs and conversions.
Marketing analytics: Turn insights on campaign performance into actionable strategies to improve your marketing.
ROI measurement: Understand your true mobile marketing ROI, enabling you to optimize your spend effectively.
Fraud protection: Advanced mobile app fraud detection and prevention tools help protect your ad spend.
How much does Appsflyer cost?
AppsFlyer has three pricing tiers based on attributed conversions (non-organic installs and re-engagements):
- Zero plan: Free forever with 12,000 lifetime conversions. Includes basic attribution, core analytics, and SKAdNetwork support.
- Growth plan: $0.07 per conversion after the first 12,000 free conversions in year one. Includes attribution for all major ad networks.
- Enterprise plan: Custom pricing. Includes premium features like Protect360, raw data access, and dedicated support.
Why do companies use Appsflyer?
According to G2 reviews, companies use Appsflyer because:
They need comprehensive attribution insights: Appsflyer enables marketers to understand which campaigns and channels are driving the best results.
It's easy to use: Reviewers note how easy Appsflyer is to use. This means they can go from idea to actionable learnings quickly.
It has a wide range of integrations: Appsflyer can connect to many different marketing tools, making it easier to manage and analyze data from multiple sources.
Bottom line
Appsflyer is the top choice for marketing teams looking to optimize their ad spend and gain deep insights into their campaigns.
7. Countly
Best for: Teams in strict regulatory environments

What is Countly?
Countly is privacy-focused product analytics platform. It emphasizes 100% data ownership and privacy compliance, supporting regulations like GDPR, HIPAA, and CCPA. Users have full control over their data, which can be self-hosted or managed in a private cloud.
Key features
Product analytics: Track user behavior, application performance, and key metrics with customizable dashboards.
Privacy compliance: Ensure compliance with GDPR, HIPAA, CCPA, and other privacy regulations.
Push notifications: Engage users with personalized push notifications based on their behavior and preferences.
Crash analytics: Monitor and resolve app crashes with detailed reports and real-time alerts.
How much does Countly cost?
Countly offers three deployment options:
- Lite (self-hosted): Free forever, open-source. Includes core analytics but limited features (no funnels, retention, cohorts, or heatmaps).
- Flex (private cloud): Free for up to 500 MAU. Paid tiers start at $40/month for 1,000 MAU; features like retention, funnels, and A/B testing are add-ons.
- Enterprise: Custom pricing based on data points. Includes all features, SSO, white-labeling, SLA support, and professional services.
Why do companies use Countly?
Based on G2 reviews, companies choose Countly because:
It's focused on privacy and compliance: Countly ensures that companies can adhere to strict regulatory requirements.
It's many tools in one: From push notifications to A/B testing to crash analytics, Countly provides many features for building great apps.
You have full data ownership: With options for self-hosting and private cloud, Countly enables companies to manage their data securely.
Countly is a great choice if you're building a strict regulatory environment. Many users complain about its bad user interface though.
Which mobile app analytics tool should you choose?
- Want an all-in-one platform that integrates mobile analytics with session replays, feature flags, A/B tests, and error tracking – without stitching together multiple tools? Go with PostHog.
- Already using Firebase for backend services and need free, unlimited analytics? Stick with Firebase.
- Product or growth team that wants powerful analytics without needing a data team to set it up? Choose Mixpanel.
- Mobile-first team that needs gesture tracking, crash context, and rage tap detection? UXCam is built for you.
- Enterprise team that needs polished dashboards, CDP capabilities, and Google/ad network integrations? Consider Amplitude.
- Marketing team focused on attribution, ad spend optimization, and campaign ROI? AppsFlyer is the industry standard.
- Require self-hosting, private cloud, or strict regulatory compliance (HIPAA, GDPR)? Countly gives you full data ownership.
Is PostHog right for you?
Here's the (short) sales pitch.
We're biased, obviously, but we think you'll love PostHog if:
- You value transparency (we're open source and open core)
- You want tools to ship, track, and analyze new features – like A/B testing, feature flags, and session replays
- You want try before you buy (we're self-serve with a generous free tier)
Check out our product pages and read our docs to learn more.
FAQ
What is mobile app analytics?
Mobile app analytics is the process of collecting, measuring, and analyzing user behavior data from iOS and Android applications. It helps product teams understand how users interact with their app — from which features get the most engagement to where users drop off in key flows.
Most mobile analytics platforms track events (like button taps, screen views, and purchases), user properties (like device type, OS version, and location), and session data (like session length and frequency). Advanced platforms also include session replay, A/B testing, and crash analytics to give teams a complete picture of the mobile experience.
What's the difference between mobile analytics and web analytics?
While both track user behavior, mobile analytics deals with unique challenges that web analytics doesn't face. Mobile apps run on diverse devices with different screen sizes, OS versions, and hardware capabilities. They also work offline, have app store distribution, and use different tracking mechanisms (SDKs vs. JavaScript snippets).
Mobile analytics platforms typically track app-specific metrics like crash-free sessions, app installs, push notification engagement, and gesture interactions (swipes, pinches, rage taps) that don't exist on the web. Some platforms like PostHog and Mixpanel support both web and mobile, while others like UXCam focus exclusively on mobile.
What's the difference between product analytics and marketing analytics for mobile apps?
Product analytics focuses on what users do inside your app — which features they use, where they get stuck, how often they return, and what drives retention. Tools like PostHog, Mixpanel, and Amplitude excel here.
Marketing analytics (also called attribution or mobile measurement) focuses on how users found your app — which ad campaigns drove installs, what the cost per acquisition was, and which channels have the best ROI. AppsFlyer is the leading tool for this.
Most teams need both: marketing analytics to optimize acquisition spend, and product analytics to understand and improve the in-app experience.
Do I need a mobile measurement partner (MMP) like AppsFlyer?
You need an MMP if you're running paid user acquisition campaigns and want to know which ads, networks, and creatives are driving installs and conversions. MMPs like AppsFlyer handle the complex work of attributing installs to specific campaigns across dozens of ad networks (Meta, Google, TikTok, etc.) while navigating iOS privacy restrictions like SKAdNetwork.
If you're not running paid campaigns or are relying primarily on organic growth, you can skip the MMP and focus on product analytics instead. Many teams use both — an MMP for acquisition data and a product analytics tool like PostHog for in-app behavior.
How do I choose between self-hosted and cloud-hosted analytics?
Cloud-hosted analytics (like Mixpanel, Amplitude, or PostHog Cloud) is easier to set up and maintain — you just integrate the SDK and start tracking. Self-hosted analytics gives you complete control over your data, which matters for companies in regulated industries (healthcare, finance, government) or those with strict data residency requirements.
Countly specializes in self-hosted deployments. The trade-off is that self-hosting requires infrastructure management and ongoing maintenance. For more options, see our guide to the best GDPR-compliant analytics tools.
What mobile analytics features should I prioritize?
It depends on your team's biggest questions:
- Understanding user flows and drop-offs: Prioritize funnels, retention analysis, and user paths
- Debugging UX issues: Look for session replay for mobile apps with gesture tracking
- Optimizing features: Look for A/B testing capabilities
- App stability concerns: Crash analytics with stack traces is essential
For most teams, starting with core product analytics (events, funnels, retention) and adding session replay provides the best foundation before expanding to more advanced features.
How do iOS privacy changes (ATT, SKAdNetwork) affect mobile analytics?
Apple's App Tracking Transparency (ATT) framework requires apps to ask permission before tracking users across other apps and websites. Most users opt out, which significantly impacts marketing attribution — you can no longer reliably track which ad drove an install for users who decline.
SKAdNetwork is Apple's privacy-preserving alternative that provides aggregate attribution data with limited granularity and delayed reporting. Product analytics (tracking behavior within your own app) is less affected since it relies on first-party data. However, cross-app user identification and some cohort analysis capabilities are limited. Tools like AppsFlyer and Mixpanel have built SKAdNetwork support to help marketers adapt to these restrictions.
Can I use multiple analytics tools together?
Yes, and many teams do. A common setup is using an MMP like AppsFlyer for attribution alongside a product analytics tool like PostHog or Mixpanel for in-app behavior. Some teams add a dedicated crash reporting tool like Firebase Crashlytics or Sentry on top of their analytics stack.
The main considerations are SDK bloat (each SDK adds to your app size and can impact performance), data consistency (making sure user IDs match across tools), and cost (paying for multiple platforms). All-in-one platforms like PostHog reduce this complexity by combining product analytics, session replay, feature flags, A/B testing, and error tracking in a single SDK.
What's the best free mobile analytics tool?
Firebase offers the most generous free tier — its analytics is completely free with no event limits. PostHog's free tier includes 1 million events and 2,500 mobile session recordings per month. Mixpanel offers 1 million events per month free, including 10,000 session replays. Countly Lite is free and open-source if you self-host, though it lacks advanced features like funnels and retention. For pure marketing attribution, AppsFlyer's Zero plan includes 12,000 lifetime conversions free.
The best choice depends on which features matter most to your team.
Which mobile app analytics tool has the best session replay?
PostHog and UXCam both offer strong mobile session replay. UXCam is purpose-built for mobile and captures gestures like swipes, pinches, and rage taps with dedicated heatmaps. PostHog offers session replay as part of a broader platform that includes analytics, feature flags, and A/B testing — so you can jump from a funnel drop-off directly into the replays that show why users are leaving.
Mixpanel added session replay in 2024 with a server-side stitching feature that lets you view replays for backend events. Amplitude also added replay but it's limited to Growth and Enterprise plans.
For a detailed comparison, see our guide to the best mobile app session replay tools.
How is PostHog different from other mobile analytics tools?
PostHog is more than a mobile analytics tool. It gives developers full context by combining all the tools needed to build a successful product in one platform — with a single SDK for mobile.
- All-in-one toolkit: Product analytics, web analytics, session replay, feature flags, experiments, surveys, error tracking, logs, workflows, and more.
- Built for mobile: Native iOS and Android SDKs with offline event queuing, gesture tracking, and mobile session replay
- Developer-first: Transparent APIs, SQL query builder, open source, and a public roadmap
- Transparent pricing: Generous free tiers and usage-based billing
- Trusted by teams: Used by 20,000+ companies including Y Combinator startups, scale-ups, and enterprises
PostHog is an all-in-one developer platform for building successful products. We provide product analytics, web analytics, session replay, error tracking, feature flags, experiments, surveys, LLM analytics, data warehouse, CDP, and an AI product assistant to help debug your code, ship features faster, and keep all your usage and customer data in one stack.